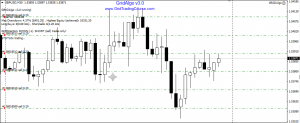
A trading grid is the main tool employed by Grid Trading to extract profit from the markets. OK, but, what exactly is it? Well, nothing fancy here, a trading grid is really just a series of trades executed at (usually) predetermined price levels – see chart 1.
chart 1 – Trading Grid on GBPUSD
The above is a screenshot from an actual trading session performed on GBPUSD. Every horizontal line shows that there’s a trade executed at this price level. You can see how it looks like there’s a grid (of trades) on the chart i.e. a trading grid.
Every price level where we execute a trade at is called a grid line. And in order to be able to calculate these price levels i.e. to define a trading grid you need to know 2 things – its base line and its grid step. The base line can be any price you choose. Often it is your starting (or first) line, the one you place your first trade at.
Grid Step is the distance between any 2 neighboring grid lines. It is usually given in pips (Forex markets). For example a Grid Step of 15 means that you have 15 pips distance between every 2 neighboring grid lines. Which means that you execute a trade on every 15 pips.
Smaller grid step means more aggressive trading. You will put more trades out there, you will have higher exposure, higher risk but you will also be able to rack up profits faster. While for more conservative trading you want to have larger grid step. In this case your grid will be able to withstand a wider range of market conditions. Generally for short term or intraday trading I use fairly small grid steps (below 30 pips).
Will continue with this topic in my next post…
